What is it?
The standard deviation provides a measure of variability in a sample or population. It is the average distance, or deviation, a point in a population (sample) is from the population (sample) mean. The standard deviation is the square root of the variance which means it is the same units of measurement as the data. This give a more interpretable picture of the spread of the data than the variance.
NOTE: Anytime I list ‘population (sample)’ this just means it can apply to a sample or a population.
What is it used for?
The standard deviation gives us a sense of the ‘spread’ of our data. It can be used in conjunction with the median and mean to gain a full view of the structure of data.
Standard deviation is also a building block for z-scores which provide a metric to compare variability in samples from different populations. Z-scores can also be used for calculating the probability of randomly selecting a sample with a specific value from a population. I will go into further detail in future posts.
Symbols & Formulas
σ - Symbol Name (Greek Letter): Sigma,
Parameter Name: Population Standard Deviation
s - Statistic Name: Sample Standard Deviation
Formulas:
Population Standard Deviation
\(\begin{equation}
\sigma = \sqrt{\Sigma(X-\mu)^2 \over N}
\end{equation}\)
Sample Standard Deviation
\(\begin{equation}
s = \sqrt{\Sigma(X-\bar{X})^2 \over (n-1)}
\end{equation}\)
n - number of scores in a sample
N - number of scores in a population
X - individual score in a population
μ - Population Mean
X̄ - Sample Mean
When Should I Use This?
Use:
It should be used to ‘get a sense of your data’, in particular the spread of your data. It is also one of the parameters of the normal distribution along with the mean.
Don’t Use:
Not sure there is a blanket time not to use it (at least in the case of exploratory analysis). But there are some things you should know (see next section).
Assumptions, Prerequisites, and Pitfalls
In the Formulas section above you may have noticed the difference in the denominators. I won’t go into detail about bias in estimators here, but know that when estimating the sample standard deviation ‘(n-1)’ is used in place of ‘n’ for an unbiased estimation of standard deviation in the sample. For more info check out this post.
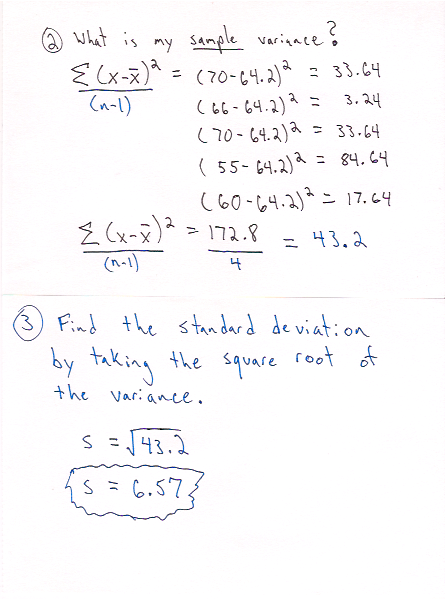
Example - No Code
Example - Code
Python
Using statistics library
>>> import statistics
>>> # create sample of floats
... sample = [1., 1., 2., 2., 3., 3., 2., 2., 1., 1.]
>>> statistics.stdev(sample)
0.7888106377466155
Using sample standard deviation formula
import statistics
import math
# create sample of floats
sample = [1., 1., 2., 2., 3., 3., 2., 2., 1., 1.]
# calculate sample mean
sample_mean = statistics.mean(sample)
numerator = 0.
for s in sample:
  numerator += (s - sample_mean)**2
sample_stdev = math.sqrt(numerator/(len(sample) - 1))
print(sample_stdev)
0.7888106377466155
R
> sample <- c(1, 1, 2, 2, 3, 3, 2, 2, 1, 1)
> sd(sample)
[1] 0.7888106