What is it?
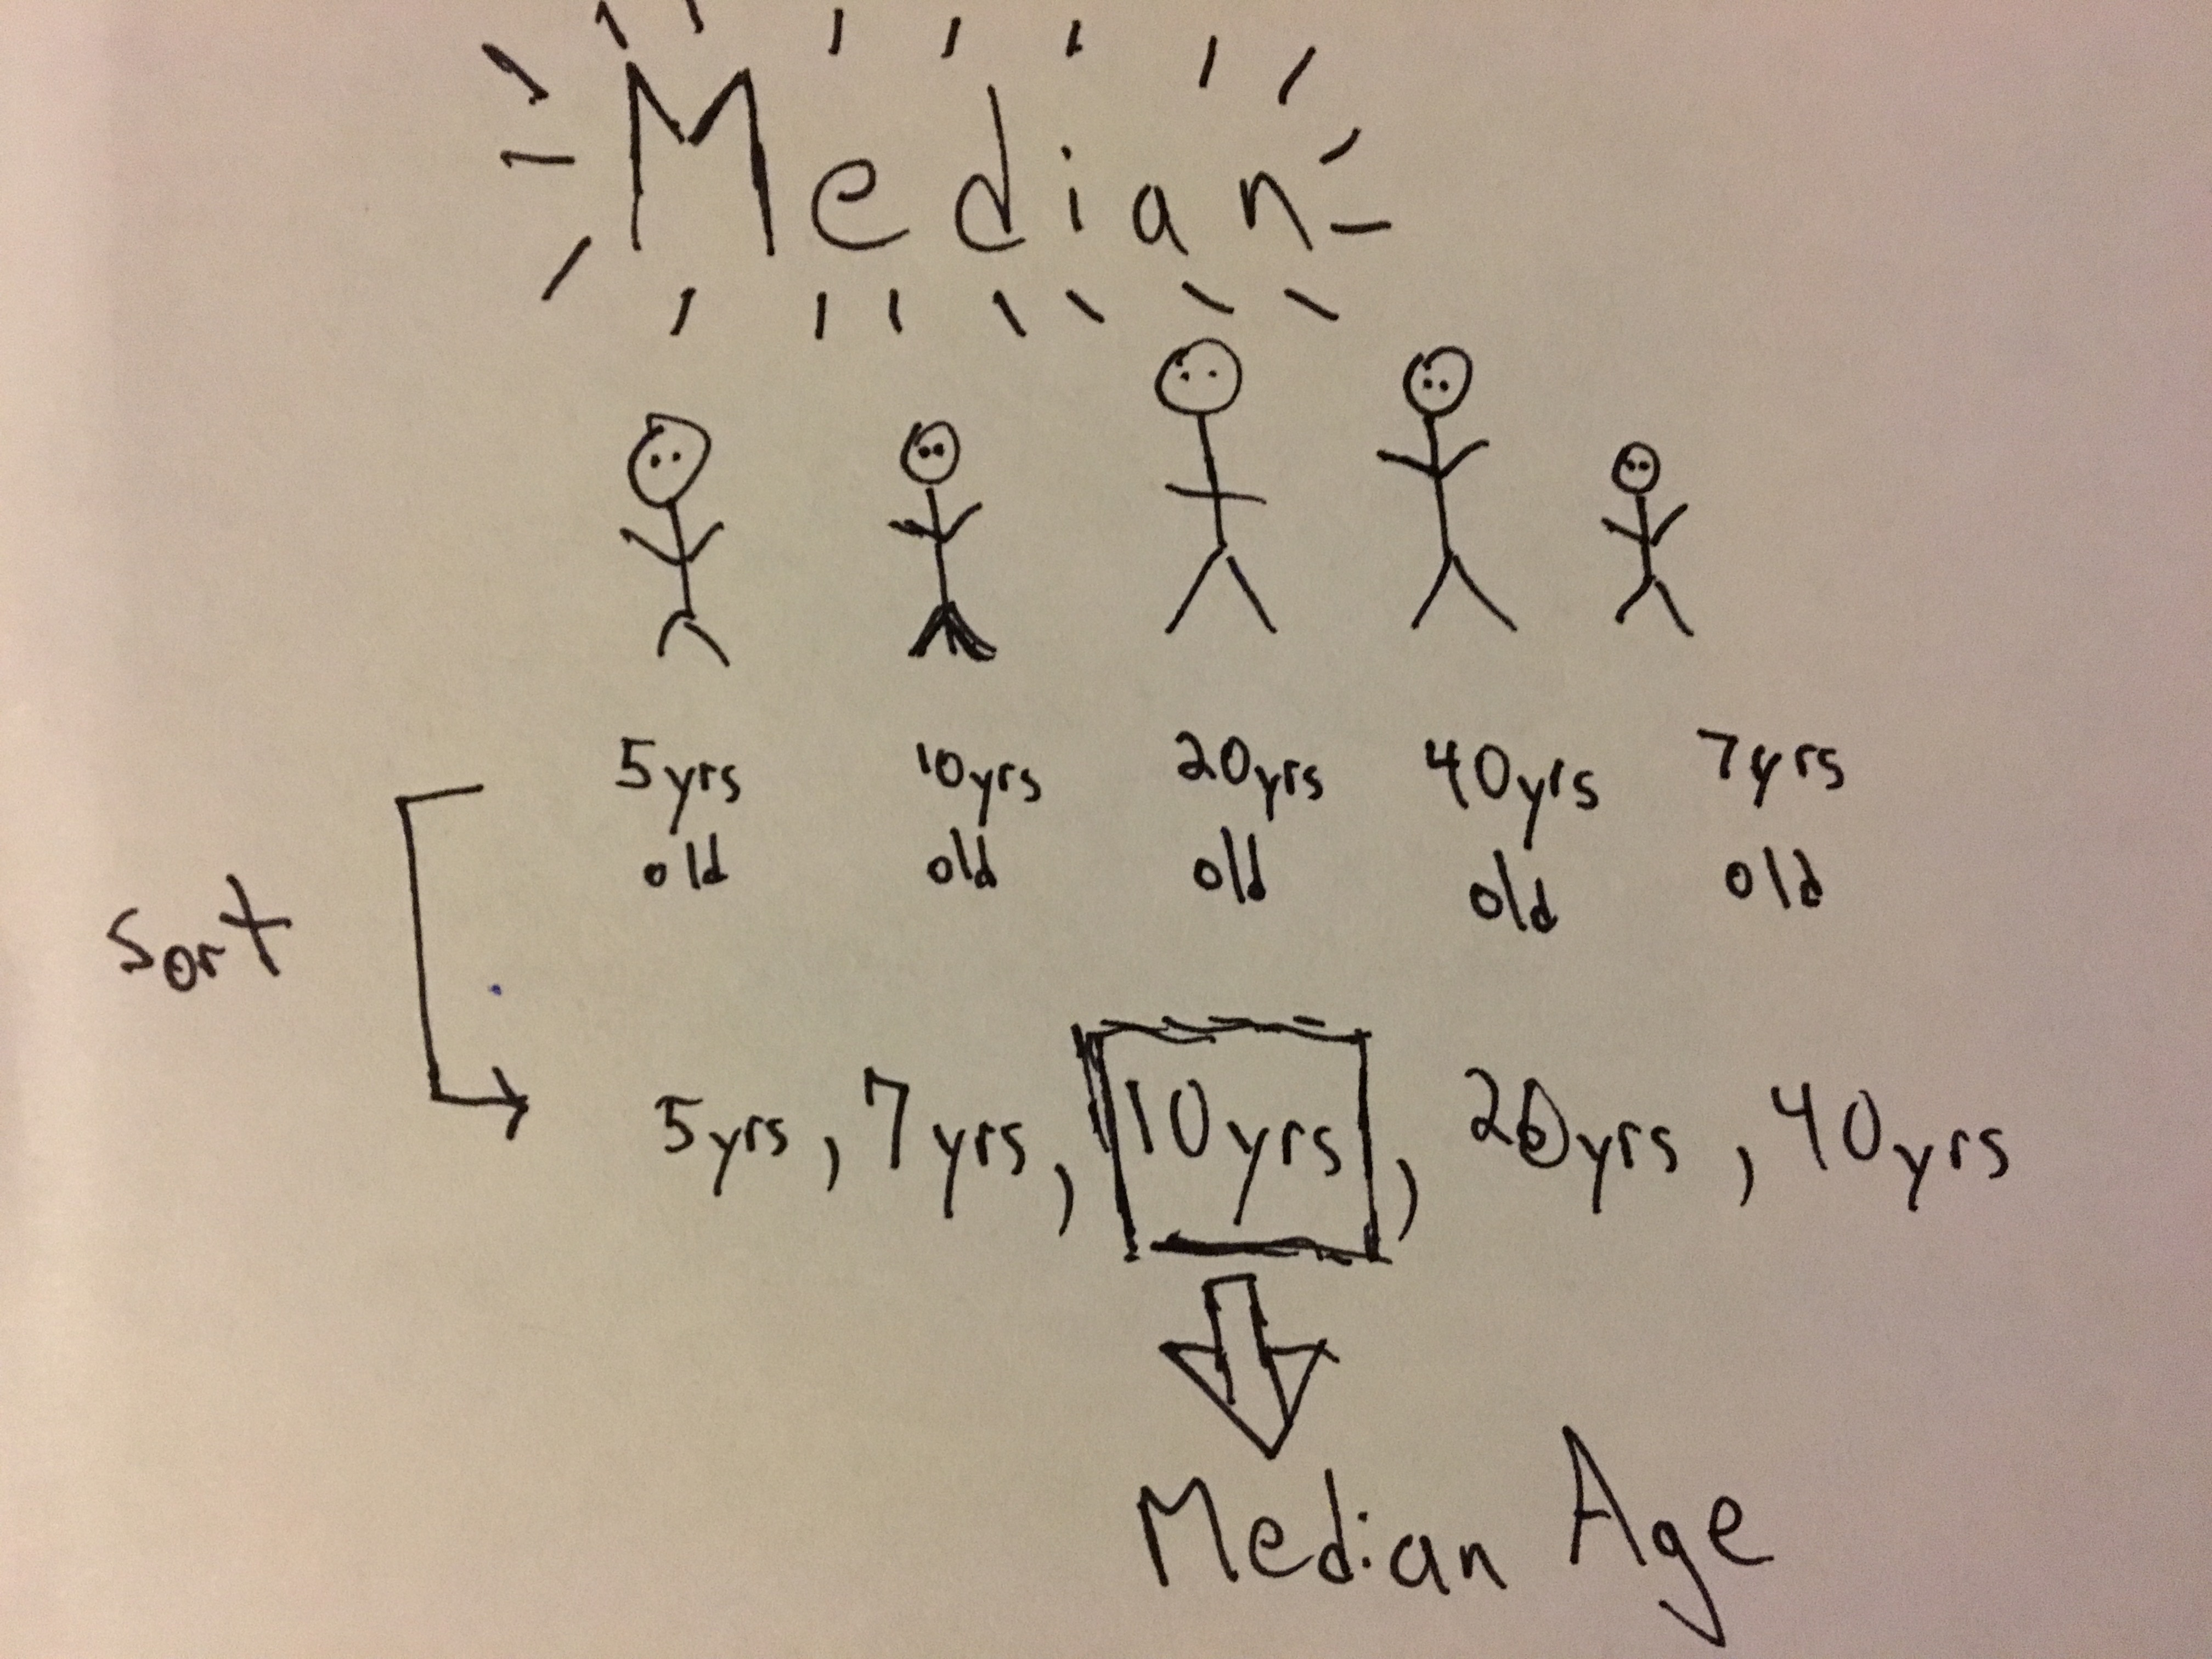
The median is the middle point of a sample or population of scores. To break it down one step further, if we have an odd number of samples and we sort them, the median is the sample in the center. In the case we have an even number of samples, the median would be the average of the two middle samples.
What is it used for?
Similar to the mean, the median is a measure of centrality which provides insight into the structure of our data. It is especially useful when used in conjunction with the mean. (Remember: the mean doesn’t tell the whole story)
Symbols & Formulas
M, P50 - Parameter Name: Population Median
\(\widetilde{X}\) - Statistic Name: “X tilda”, Definition: Sample Median
Formula - Sort samples, select sample in middle position (if odd number of samples). Otherwise take the mid-point between the two samples in the center.
When Should I Use This?
Use:
It should be used to ‘get a sense of your data’ in conjuction with the mean and standard deviation.
Don’t Use:
Not sure there is a blanket time not to use it (at least in the case of exploratory analysis). But there are some things you should know (see next section).
Assumptions, Prerequisites, and Pitfalls
The median is great for giving us an idea of what our data looks like….. but it does not tell the whole story. This is exactly why we have other measures of centrality like mean and measures of variation such as standard deviation and variance.
Example - No Code
Example - Code
Python
>>> import statistics
>>> sample = [99,44, 105, 36, 87, 100]
>>> statistics.median(sample)
93.0
>>> sample = [99,44, 105, 36, 87]
>>> statistics.median(sample)
87
R
> sample = c(99,44, 105, 36, 87, 100)
> median(sample)
[1] 93
> sample = c(99,44, 105, 36, 87)
> median(sample)
[1] 87