HTML Tables in Rmarkdown
The other day I needed a template to create a table of images in an Rmarkdown document. I found a few stack overflow posts, but nothing that really addressed this issue, so I wanted to document the template I came up with in a short post.
To clarify: I had a large number of images, not generated in the Rmd, that had to be displayed. If you are interested in displaying your plots generated in the Rmd, this approach is overkill. Instead you may want to take a look at this post by Karl Broman.
HTML in Rmarkdown
A few things to know before getting started:
- Pandoc interprets material between HTML block tags as Markdown. To circumvent these issues a markdown extension needs to be specified in the YAML portion of the Rmd document. (Check out this RStudio reference about HTML/Pandoc for more details)
- results=’asis’ : In the example I’ll go through I’ll be generating HTML code for the table. In order to use this HTML the chunk needs to print out the results ‘as is’.
- Be aware of how knitr deals with file paths. The example I provide uses a relative path to the Rmd file. You have the option of setting an alternate root directory for knitr to use as well.
Template
YAML
Below is the YAML portion of the Rmd file. I provide a document title, set the output type as html_document, and specify that I don’t want markdown in between my HTML blocks. This will ensure the tables I create will render correctly and not just as HTML text. To learn more about the md_extensions check out this page.
---
title: "Image Template"
output:
  html_document:
    md_extensions: -markdown_in_html_blocks

---
Create Plots and Save images
Below is my base RProject stucture. I have the Rproj file and a directory labeled as doc in the main project directory. In the doc subdirectory is the Rmd file and an empty directory labeled as figures where I will store the plots I generate.
total 8
8 -rw-r--r--@ 1 tufts  staff  205 Aug 31 08:09 ImageTableTemplate.Rproj
0 drwxr-xr-x@ 5 tufts  staff  170 Aug 31 19:30 doc

./doc:
total 3640
   8 -rw-r--r--@ 1 tufts  staff     1436 Aug 31 19:29 ImageTableTemplate.Rmd
   0 drwxr-xr-x@ 2 tufts  staff       68 Aug 31 19:30 figures

./doc/figures:
To generate some plots I use the code below. After generating each plot I save it as a png file. I’m aware you could display plots in a grid format using only R, but the premise of this post is about displaying image files in a table. The code below creates 4 directories with 12 plots each resulting in a total of 48 plots.
n <- 48 # number of pngs to create
       # this will also be used for the number of samples in each plot
mainDir <- paste0(getwd(), '/figures')
g <- 0
dir.create(file.path(mainDir, g))
for(i in 1:n){

  x = rnorm(n)
  y = rnorm(n)
  png(paste0('figures/',g,'/plot_',i,'.png'))
  plot(x,y)
  dev.off()
  if(i%%12 == 0 & i != n){
    g <- g + 1
    dir.create(file.path(mainDir, g))
  }
}
Create the HTML Document
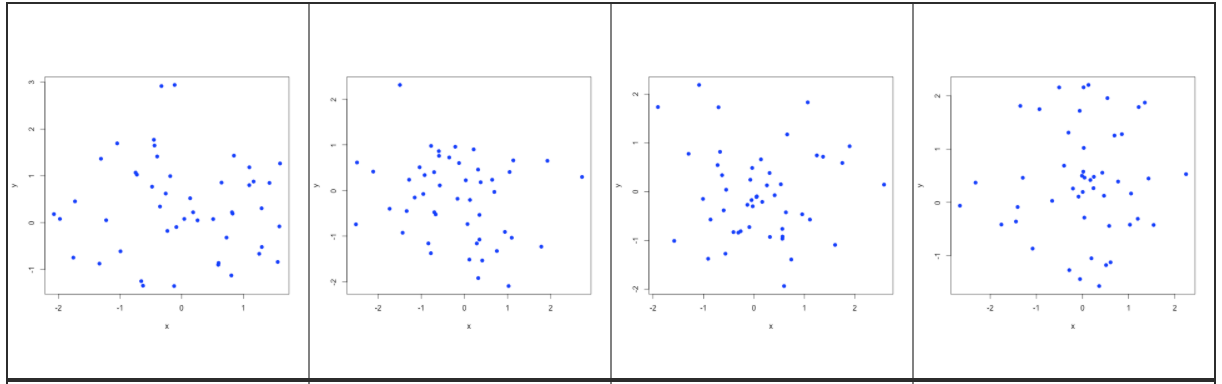
Below is the code chunk for generating the HTML table of images in the Rmd file.
For each of the figures subdirectories a single table is made. Each row
of the table contains 4 columns containing an image in each cell. Each table is
3 rows (3 rows, 4 columns, 12 cells total).
```{r  echo=F ,results='asis' }

directories <- list.dirs('figures/', recursive = F, full.names = T)

for(d in 1:length(directories)){

cat('<h1>', paste0('TABLE: ', sub('figures//', '', directories[d])), '</h1> <p>')

plots <- list.files(directories[d], pattern="*.png")
plots <- paste0(directories[d], '/', plots)


if(length(plots > 0)){
# #create an html table with float left/right, whatever....
  for(i in seq(1,length(plots),4)){
    cat('<table border="1">
    <tr>
    <td height="250"><img src=',plots[i],' height="200" width="200"/></td>
    <td height="250"><img src=',plots[i+1],' height="200" width="200"/></td>
    <td height="250"><img src=',plots[i+2],' height="200" width="200"/></td>
    <td height="250"><img src=',plots[i+3],' height="200" width="200"/></td>
    </tr>
    </table>')
    }

  }
}

```
Below is the resulting directory structure after knitting the Rmd document to HTML.
total 8
8 -rw-r--r--@ 1 tufts staff 205 Aug 31 08:09 ImageTableTemplate.Rproj
0 drwxr-xr-x@ 5 tufts staff 170 Aug 31 19:48 doc
./doc:
total 3664
8 -rw-r--r--@ 1 tufts staff 1436 Aug 31 19:48 ImageTableTemplate.Rmd
3656 -rw-r--r--@ 1 tufts staff 1868078 Aug 31 19:48 ImageTableTemplate.html
0 drwxr-xr-x@ 6 tufts staff 204 Aug 31 19:48 figures
./doc/figures:
total 0
0 drwxr-xr-x@ 14 tufts staff 476 Aug 31 19:48 0
0 drwxr-xr-x@ 14 tufts staff 476 Aug 31 19:48 1
0 drwxr-xr-x@ 14 tufts staff 476 Aug 31 19:48 2
0 drwxr-xr-x@ 14 tufts staff 476 Aug 31 19:48 3
./doc/figures/0:
total 480
40 -rw-r--r--@ 1 tufts staff 18202 Aug 31 19:48 plot_1.png
40 -rw-r--r--@ 1 tufts staff 18016 Aug 31 19:48 plot_10.png
40 -rw-r--r--@ 1 tufts staff 18063 Aug 31 19:48 plot_11.png
40 -rw-r--r--@ 1 tufts staff 18338 Aug 31 19:48 plot_12.png
40 -rw-r--r--@ 1 tufts staff 17863 Aug 31 19:48 plot_2.png
40 -rw-r--r--@ 1 tufts staff 18093 Aug 31 19:48 plot_3.png
40 -rw-r--r--@ 1 tufts staff 17839 Aug 31 19:48 plot_4.png
40 -rw-r--r--@ 1 tufts staff 18385 Aug 31 19:48 plot_5.png
40 -rw-r--r--@ 1 tufts staff 19462 Aug 31 19:48 plot_6.png
40 -rw-r--r--@ 1 tufts staff 19500 Aug 31 19:48 plot_7.png
40 -rw-r--r--@ 1 tufts staff 18598 Aug 31 19:48 plot_8.png
40 -rw-r--r--@ 1 tufts staff 18459 Aug 31 19:48 plot_9.png
./doc/figures/1:
total 480
40 -rw-r--r--@ 1 tufts staff 18465 Aug 31 19:48 plot_13.png
40 -rw-r--r--@ 1 tufts staff 18384 Aug 31 19:48 plot_14.png
40 -rw-r--r--@ 1 tufts staff 18054 Aug 31 19:48 plot_15.png
40 -rw-r--r--@ 1 tufts staff 17823 Aug 31 19:48 plot_16.png
40 -rw-r--r--@ 1 tufts staff 18147 Aug 31 19:48 plot_17.png
40 -rw-r--r--@ 1 tufts staff 17638 Aug 31 19:48 plot_18.png
40 -rw-r--r--@ 1 tufts staff 19379 Aug 31 19:48 plot_19.png
40 -rw-r--r--@ 1 tufts staff 18462 Aug 31 19:48 plot_20.png
40 -rw-r--r--@ 1 tufts staff 18043 Aug 31 19:48 plot_21.png
40 -rw-r--r--@ 1 tufts staff 19665 Aug 31 19:48 plot_22.png
40 -rw-r--r--@ 1 tufts staff 19360 Aug 31 19:48 plot_23.png
40 -rw-r--r--@ 1 tufts staff 18347 Aug 31 19:48 plot_24.png
./doc/figures/2:
total 480
40 -rw-r--r--@ 1 tufts staff 18331 Aug 31 19:48 plot_25.png
40 -rw-r--r--@ 1 tufts staff 18298 Aug 31 19:48 plot_26.png
40 -rw-r--r--@ 1 tufts staff 18441 Aug 31 19:48 plot_27.png
40 -rw-r--r--@ 1 tufts staff 19080 Aug 31 19:48 plot_28.png
40 -rw-r--r--@ 1 tufts staff 18443 Aug 31 19:48 plot_29.png
40 -rw-r--r--@ 1 tufts staff 18552 Aug 31 19:48 plot_30.png
40 -rw-r--r--@ 1 tufts staff 18181 Aug 31 19:48 plot_31.png
40 -rw-r--r--@ 1 tufts staff 18531 Aug 31 19:48 plot_32.png
40 -rw-r--r--@ 1 tufts staff 18064 Aug 31 19:48 plot_33.png
40 -rw-r--r--@ 1 tufts staff 18831 Aug 31 19:48 plot_34.png
40 -rw-r--r--@ 1 tufts staff 20115 Aug 31 19:48 plot_35.png
40 -rw-r--r--@ 1 tufts staff 18168 Aug 31 19:48 plot_36.png
./doc/figures/3:
total 488
40 -rw-r--r--@ 1 tufts staff 18120 Aug 31 19:48 plot_37.png
40 -rw-r--r--@ 1 tufts staff 18006 Aug 31 19:48 plot_38.png
40 -rw-r--r--@ 1 tufts staff 17529 Aug 31 19:48 plot_39.png
40 -rw-r--r--@ 1 tufts staff 18403 Aug 31 19:48 plot_40.png
40 -rw-r--r--@ 1 tufts staff 17913 Aug 31 19:48 plot_41.png
40 -rw-r--r--@ 1 tufts staff 18258 Aug 31 19:48 plot_42.png
40 -rw-r--r--@ 1 tufts staff 17907 Aug 31 19:48 plot_43.png
40 -rw-r--r--@ 1 tufts staff 18442 Aug 31 19:48 plot_44.png
40 -rw-r--r--@ 1 tufts staff 19318 Aug 31 19:48 plot_45.png
40 -rw-r--r--@ 1 tufts staff 18102 Aug 31 19:48 plot_46.png
40 -rw-r--r--@ 1 tufts staff 19262 Aug 31 19:48 plot_47.png
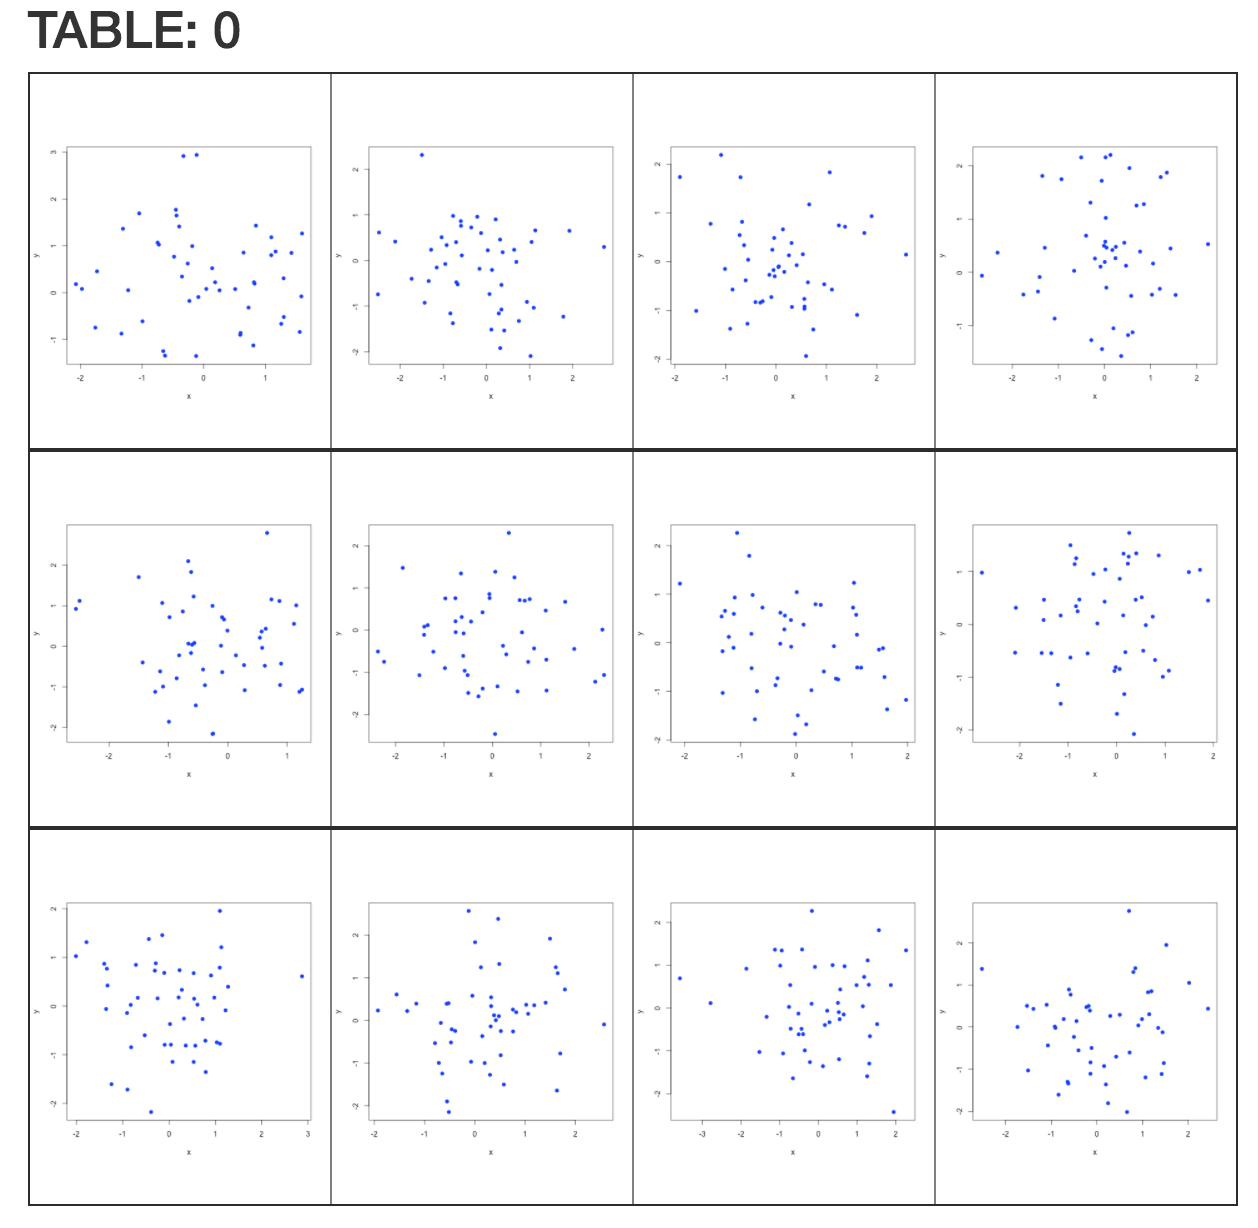
48 -rw-r--r--@ 1 tufts staff 21050 Aug 31 19:48 plot_48.pngBelow is an example of one of the tables. The complete document can be seen by clicking on the image below.
A Final Note
This template will only work for creating HTML documents. HTML tables won’t be rendered correctly into PDF via Pandoc (or maybe I should say I haven’t figured out how to do this in an easily reproducable fashion). That being said, I’ll be following up this post with a template for creating a table of images using LaTeX in RMarkdown.
A copy of the template can be found in this repo.