Creating a Table of Images: The LaTeX/PDF Version
In my previous post I provided a template/example to create a table of images in a RMarkdown document which would be rendered as HTML. The focus of this post is to provide a method of creating a table of images using LaTeX which can then be rendered as PDF.
Prerequisites
Please download/pull the HTML-Image-Tables-RMarkdown repo. I have updated the repo, so that it also includes the image files created in the HTML table post. The LaTeX template is titled ‘ImageTableTemplate_LaTeX.Rmd’.
Template
The LaTeX table template is a bit more straight forward in comparison to the HTML tables. Unlike the HTML table of images, we don’t have to specify any specific markdown extensions.
As with the HTML example the YAML is specified, in particular we list the type of output - PDF. Then the file names are gathered into two vectors. Each vector will be used to create a row in the table. From this point it is all LaTeX using the tabular package. Columns are separated by ‘‘&’’ and rows are separated with ‘‘//’’. The graphics are displayed using the includegraphics label and the file names are inserted inline. hline creates a horizontal line between rows.
---
title: "LaTeX image table template"
author: "Chris Tufts @devlintufts"
date: "November 6, 2016"
output: pdf_document
---
```{r setup, include=FALSE}
knitr::opts_chunk$set(echo = FALSE)
```
```{r pressure, echo=FALSE}
# create file lists
plot_file_0 <- list.files('figures/0/', full.names = T, recursive = F)[1:5]
plot_file_1 <- list.files('figures/1/', full.names = T, recursive = F)[1:5]
```
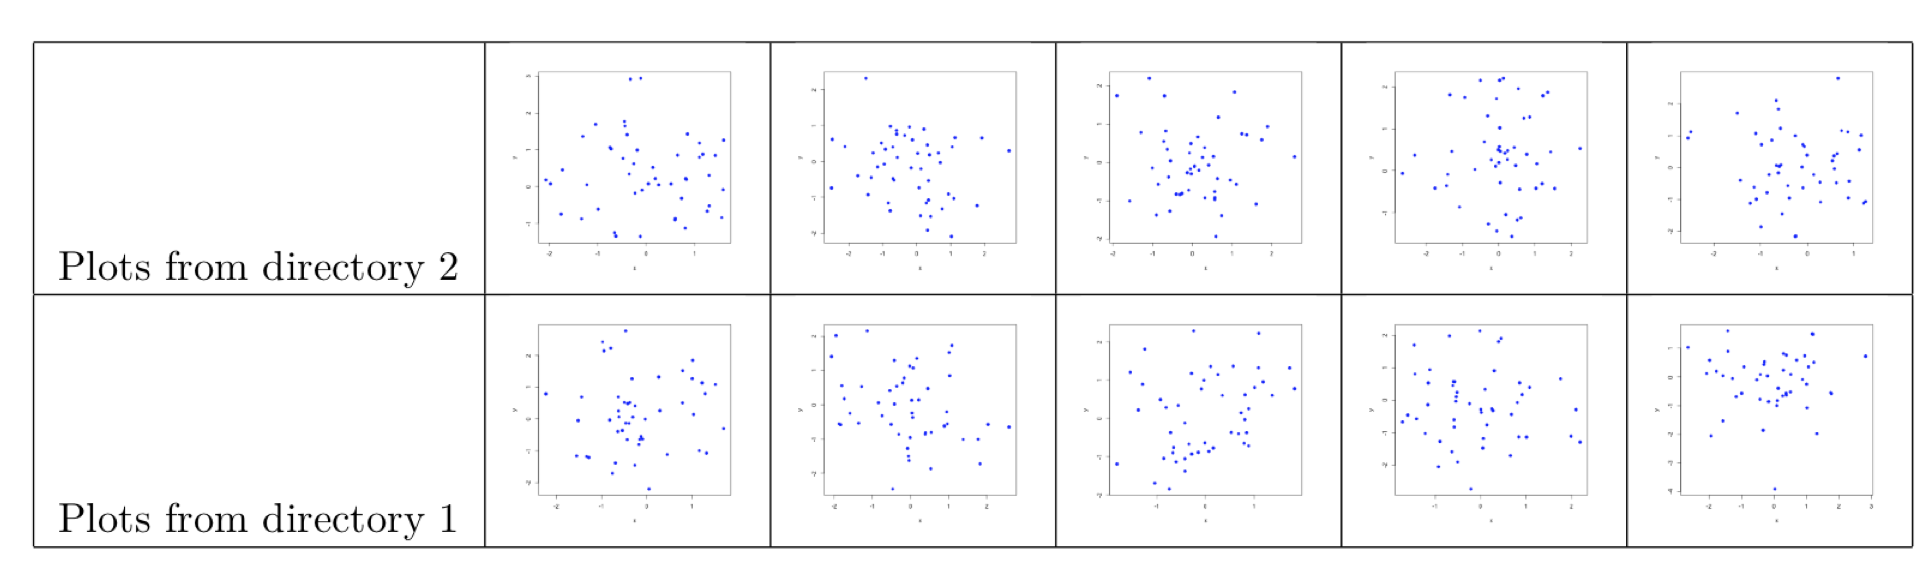
\begin{tabular}{|c|c|c|c|c|c|}
\hline
Plots from directory 2 &
\includegraphics[width=20mm]{`r plot_file_0[1]`} &
\includegraphics[width=20mm]{`r plot_file_0[2]`} &
\includegraphics[width=20mm]{`r plot_file_0[3]`} &
\includegraphics[width=20mm]{`r plot_file_0[4]`} &
\includegraphics[width=20mm]{`r plot_file_0[5]`} \\
\hline
Plots from directory 1 &
\includegraphics[width=20mm]{`r plot_file_1[1]`} &
\includegraphics[width=20mm]{`r plot_file_1[2]`} &
\includegraphics[width=20mm]{`r plot_file_1[3]`} &
\includegraphics[width=20mm]{`r plot_file_1[4]`} &
\includegraphics[width=20mm]{`r plot_file_1[5]`} \\
\hline
\end{tabular}The resulting output is shown below.
