What is it?
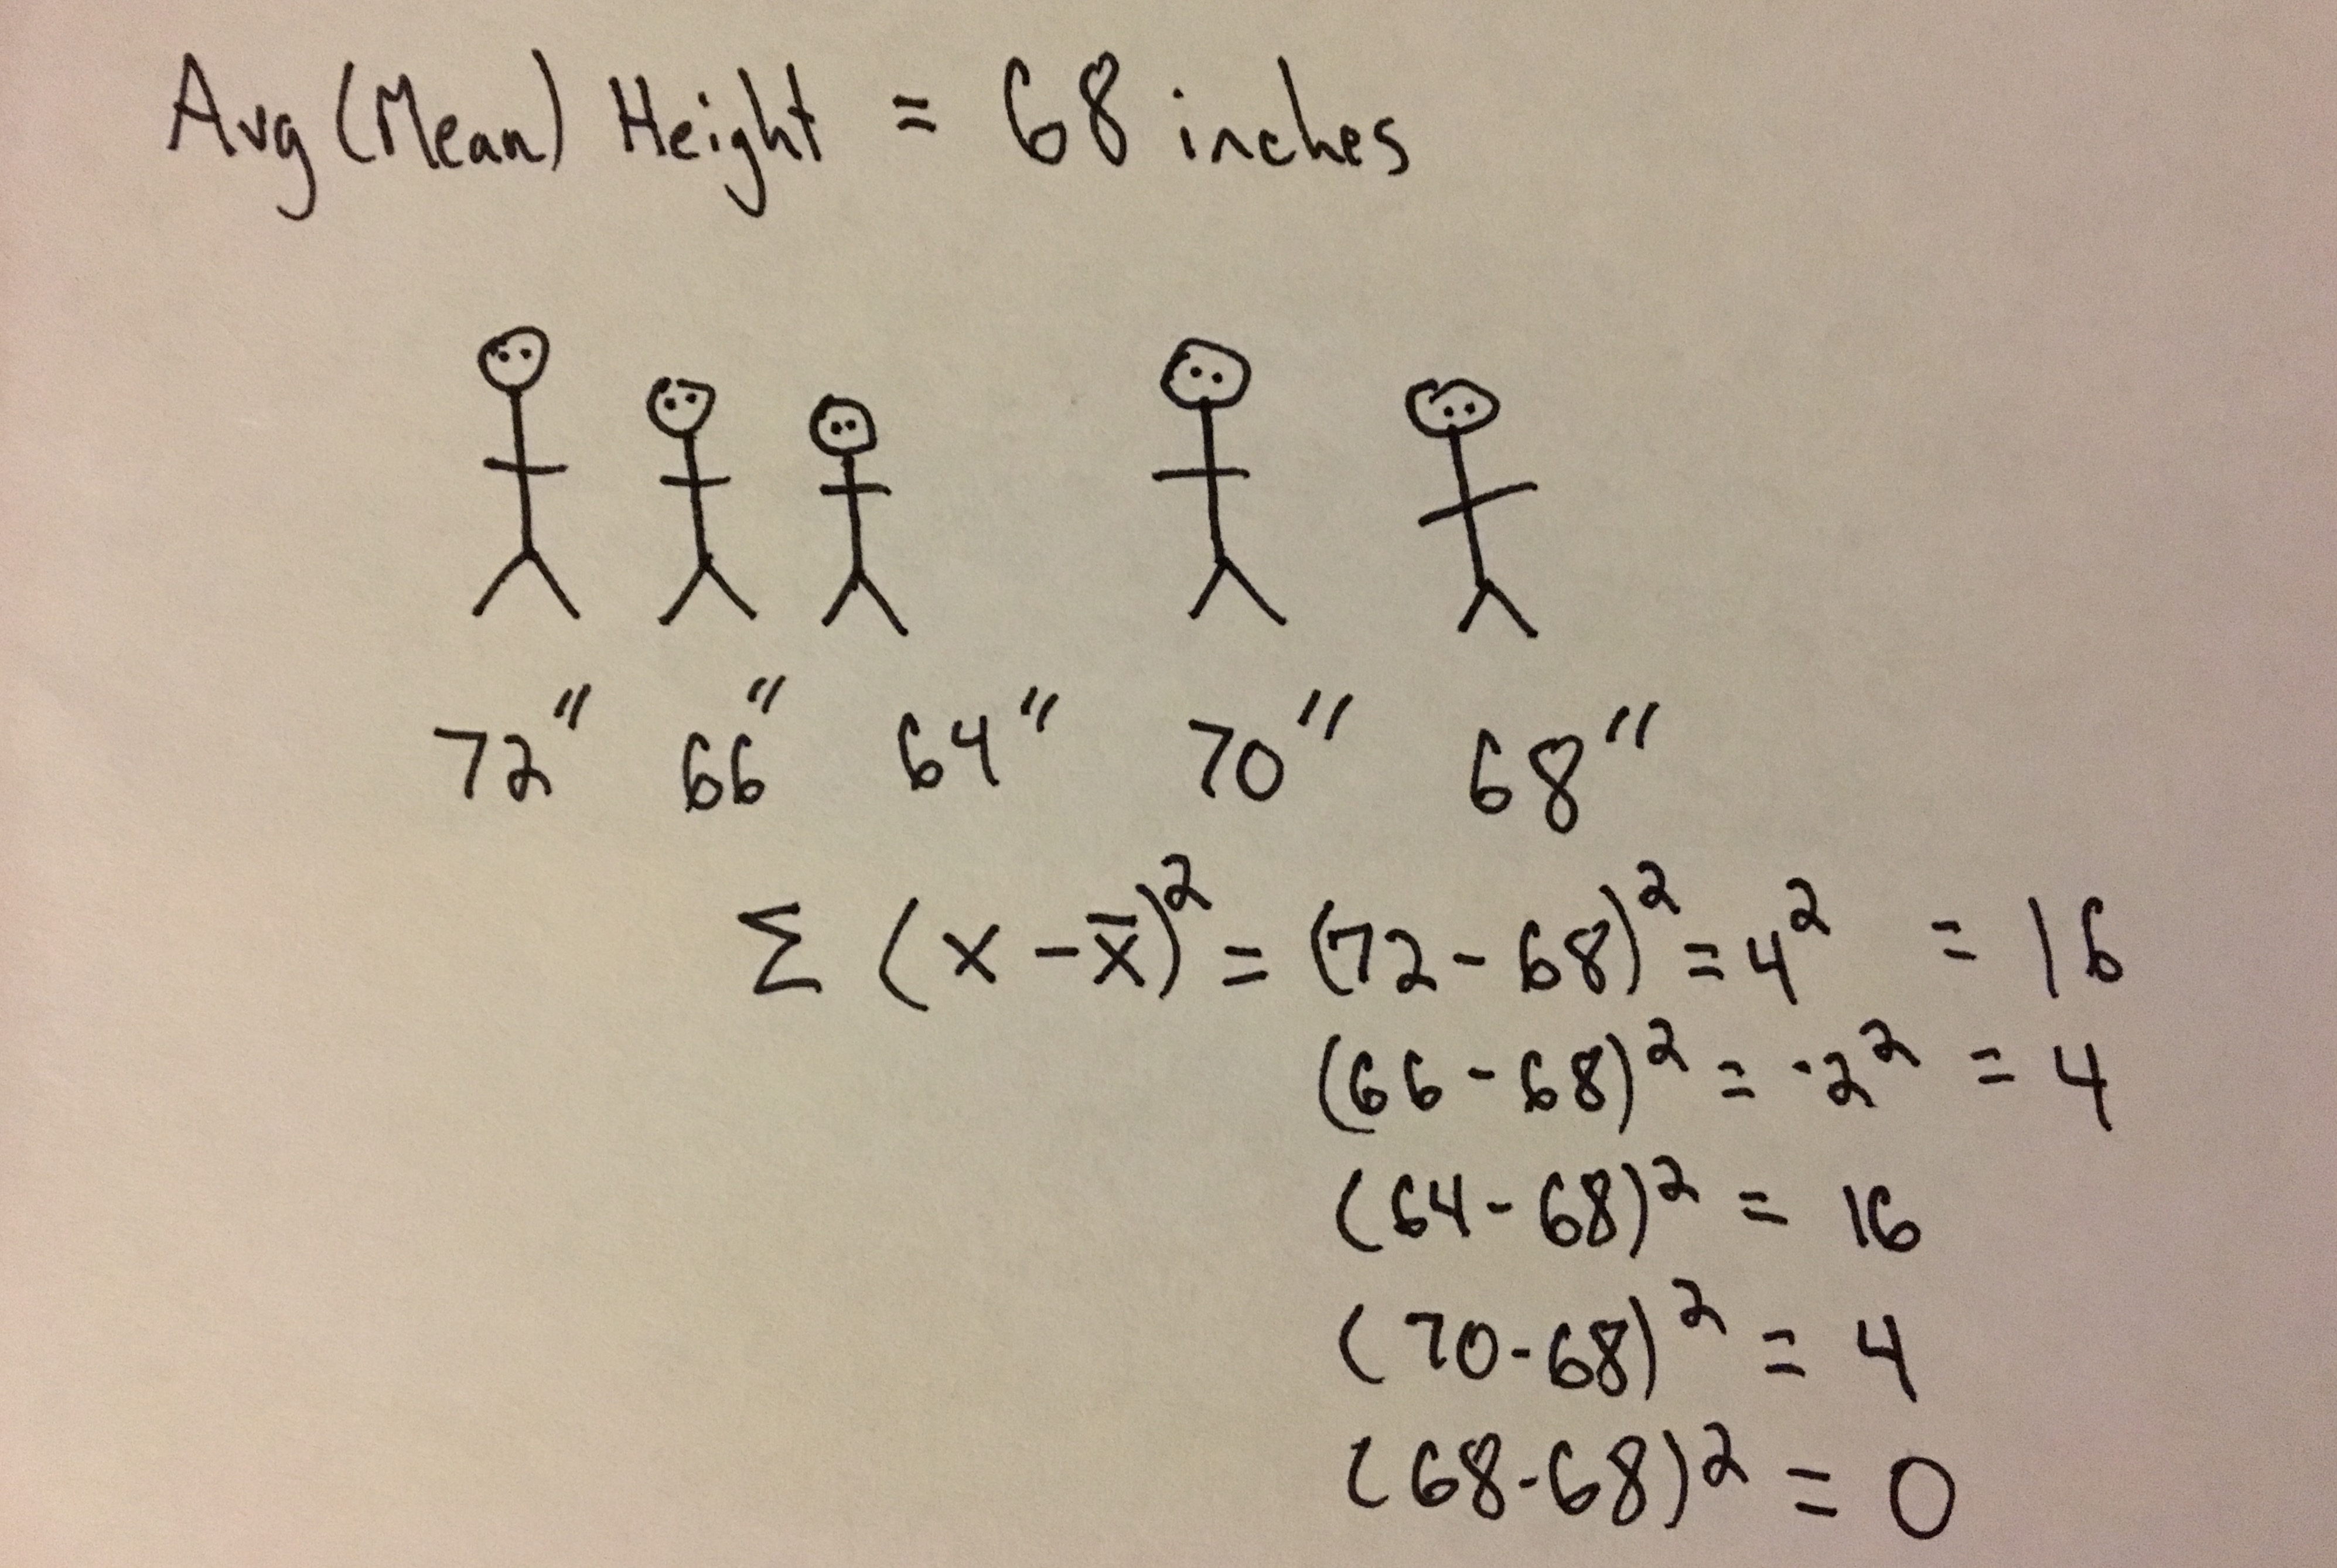
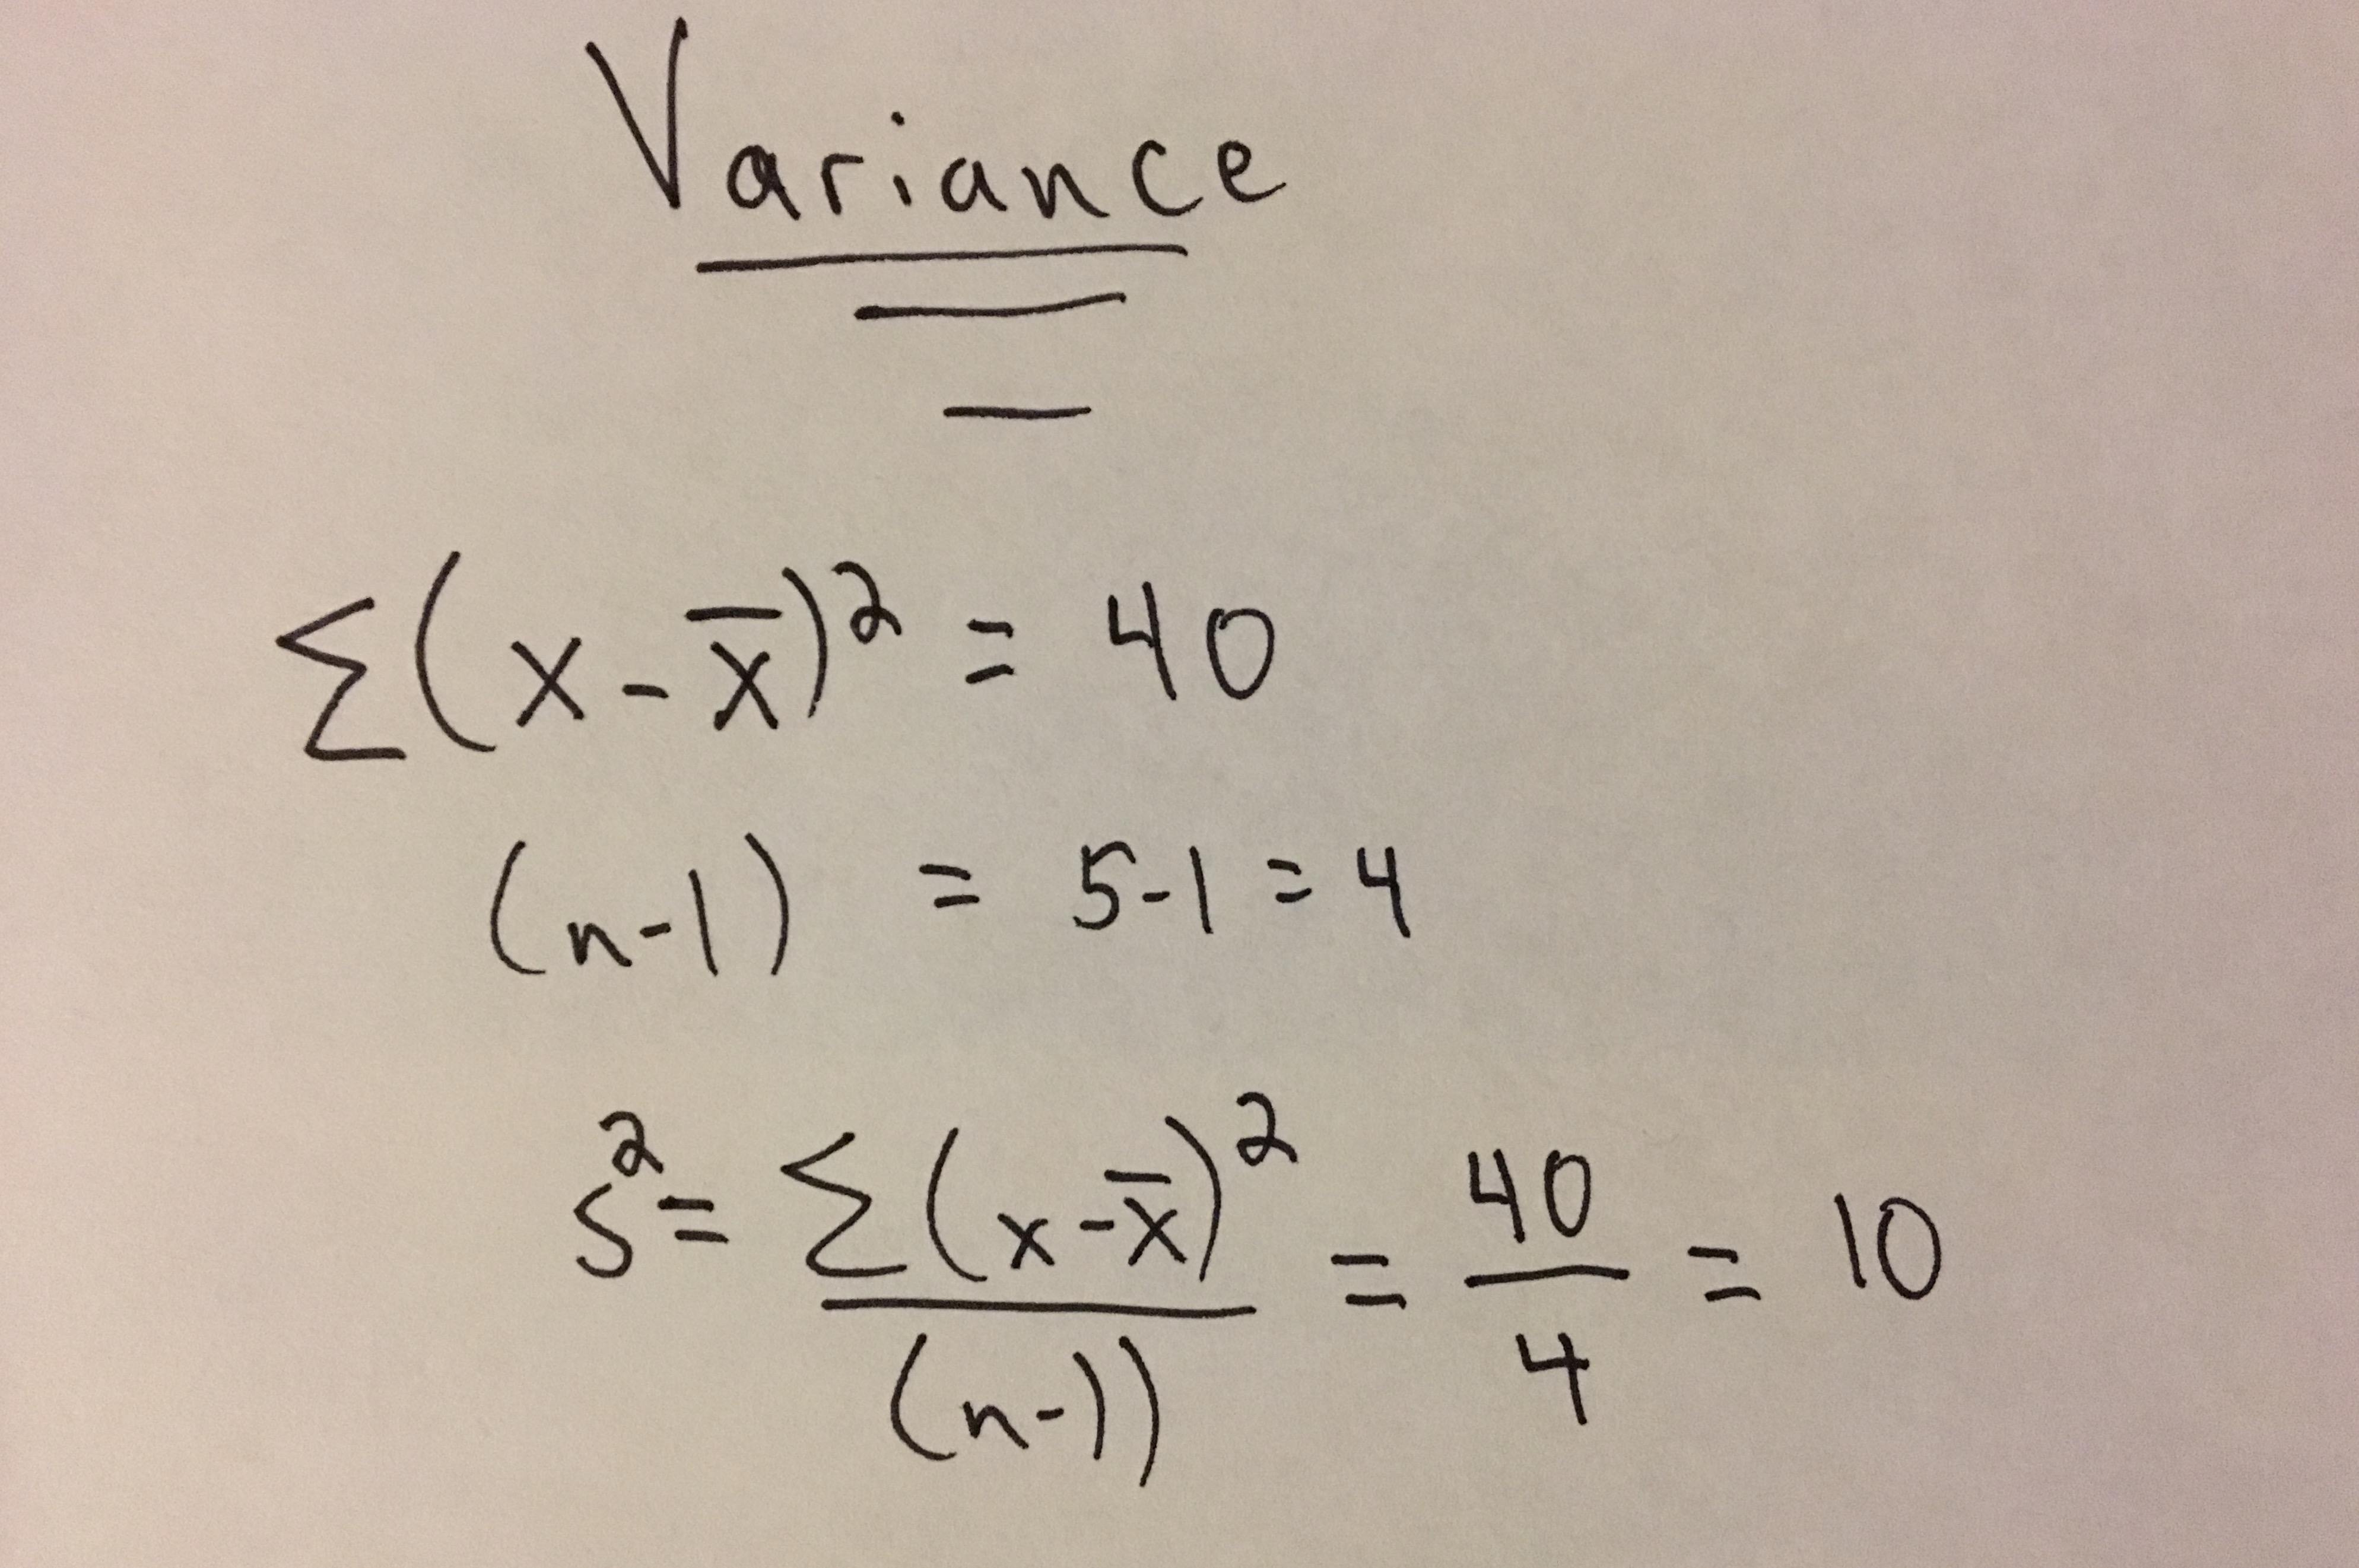
The variance provides a measure of variability in a sample or population. It is the squared average distance, or deviation, a point in a population (sample) is from the population (sample) mean.
NOTE: Anytime I list ‘population (sample)’ this just means it can apply to a sample or a population.
What is it used for?
The variance gives us a sense of the ‘spread’ of our data. It can be used in conjunction with the median and mean to gain a full view of the structure of data. However most people will opt for the square root of the variance, the standard deviation, as it will have the same units as the data and is therefore a bit more straightforward to interpret.
Although standard deviation is used for gaining a general idea of data spread, variance is extremely important in many statistical applications. There a variety of techniques for analysis of variance (ANOVA) along with measures of ‘explained variance’ which are extremely important when interpreting experimental results and comparisons.
Symbols & Formulas
σ2 - Symbol Name (Greek Letter): Sigma (squared),
Parameter Name: Population Variance
s2 - Statistic Name: Sample Variance
Formulas:
Population Variance
\(\begin{equation}
\sigma^2 = {\Sigma(X-\mu)^2 \over N}
\end{equation}\)
Sample Variance
\(\begin{equation}
s^2 = {\Sigma(X-\bar{X})^2 \over (n-1)}
\end{equation}\)
n - number of scores in a sample
N - number of scores in a population
X - individual score in a population
μ - Population Mean
X̄ - Sample Mean
When Should I Use This?
Use:
It should be used to ‘get a sense of your data’, in particular the spread of your data. It is also used as a component of statistical tests such as ANOVA.
Don’t Use:
If you want to understand the spread of your data on the same scale (same units) as the sample values (or mean or median) it is better to use the standard deviation (the square root of the variance).
Assumptions, Prerequisites, and Pitfalls
In the Formulas section above you may have noticed the difference in the denominators. I won’t go into detail about bias in estimators here, but know that when estimating the sample variance ‘(n-1)’ is used in place of ‘n’ for an unbiased estimation of variance in the sample. For more info check out this post.
Example - No Code

Example - Code
Python
Using statistics library
>>> import statistics
>>> # create sample of floats
... sample = [1., 1., 2., 2., 3., 3., 2., 2., 1., 1.]
>>> statistics.variance(sample)
0.6222222222222222
Using sample variance formula
import statistics
# create sample of floats
sample = [1., 1., 2., 2., 3., 3., 2., 2., 1., 1.]
# calculate sample mean
sample_mean = statistics.mean(sample)
numerator = 0.
for s in sample:
  numerator += (s - sample_mean)**2
sample_var = numerator/(len(sample) - 1)
print(sample_var)
0.622222222222222
R
> sample <- c(1, 1, 2, 2, 3, 3, 2, 2, 1, 1)
> var(sample)
[1] 0.6222222